Customer reviews analytics can sometimes seem a very simple task however there always can be found new ways to look at it.
When we think of customer reviews, the first thing that comes to mind is the numbers(the quantitative part). However, the review analytics incorporates other aspects such as qualitative, and competitive analytics.
Even if the reviews contain text feedback, which represents the qualitative part, they are easily associated with numbers such as rating, number of reviews, volume evolution, etc.
In this article, we will look more into the details of these numbers.
Rank (star rating)
The rank usually represents the average star rating of all reviews. In some cases, like Amazon, the rank isn’t the average rating as expected. In this case, they use an undisclosed formula where Amazon weights more the ratings from certain reviews than others. Some sources tell us that reviews with more helpful votes weigh more.
Considering most buying decisions are based on this rank it can be used to compare how your product performs compared with the average rank in its category. If this is below the category average it is a sign that you should take some actions to improve it or consider changing the product in itself, if possible.
Volume (the number of reviews)
The volume represents the number of reviews. The buyers consider this before making a purchase. A product or service with a low number of reviews is most of the time seen with mistrust, even if it has a great rank.
Trend
Evolution in time of rank or number of reviews(the volume) represents a trend. When we talk about trends we can consider several metrics besides rank and volume earlier mentioned. Compared with the rank, a trend offers you an insight into how your product performs without needing to compare it with other products.
The volume trend shows the speed of generating reviews and it is of course correlated with sales.
The rank trend helps brands to improve the product and offers real-time tracking of customers’ perceptions.
Histogram
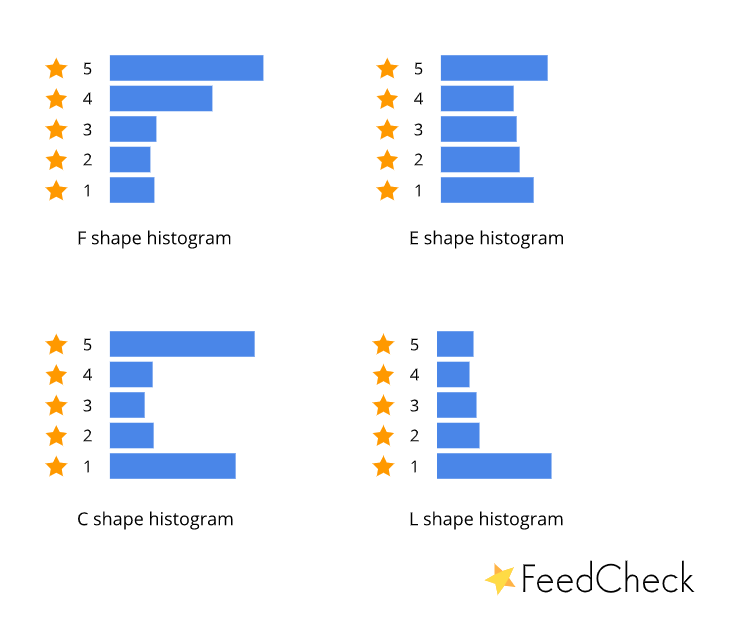
Beyond the proportion of rating distribution, from our experience, we noticed the histogram contains a hidden insight. The shape of the histogram tells us how the product is perceived and if there are many fake reviews. Let’s take a few examples of how we usually judge review histograms:

F shape – The product is well received by its customers, and most of them are very satisfied.
E shape – There are both satisfied and unsatisfied customers. The goal here is to satisfy more customers and transform the E shape histogram into an F shape histogram.
C shape – This shape shows a lot of reviews at extremes (5 stars and 1 star). In most cases, fake 5 starts reviews have been added to compensate for the negative feedback left by customers of 1-star reviews.
L shape – In this case, there are a lot of negative reviews, and the product needs to be retired or significantly improved.
NPS
The Net Promoter Score is a metric with values from -100 to 100 that measures the willingness of customers to recommend the product or service. If the product has reviews the NPS is easily computed by using reviews data. We consider 5-star reviews promoters, 4-star reviews neutral, and 1 to 3-star reviews detractors. In this way, we obtain NPS from our customers without sending surveys.
Considering the median NPS values of the following categories:
- Professional Services (legal, financial, etc.): +50
- Technology companies (telecommunications, computer manufacturers, etc.): +40
- Consumer goods and services (retailers, restaurants, etc.): +50
This is a summary of how we look at quantitative metrics and what decisions we can make based on these numbers.
Source for NPS median values: https://www.surveymonkey.com/curiosity/what-is-a-good-net-promoter-score/
